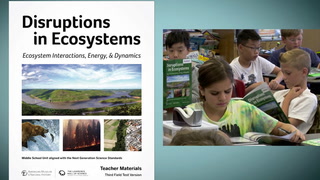
Analyzing Patterns in Ecosystems Transcript
Speaker 1: One point five, we are going to be analyzing patterns in the ecosystems.
Speaker 2: So the guiding question for 1.5 is, how do biotic and abiotic factors affect patterns of interaction amongst organisms?
Speaker 1: Organisms in an ecosystem interact with both living or biotic, and non-living or abiotic factors.
Speaker 2: So in this activity the students read about six scenarios relating to biotic or abiotic factors affecting a population. They identify patterns of interaction and then they have to match it to graphs.
Speaker 3: For competition I did coyote and werewolves.
Speaker 2: 1.3 the students have learnt the patterns of interaction. They had gotten a lot of practice on it. And in 1.4 the students got practice reading graphs and describing them.
1.5 is an elaborate activity in which students have a chance to apply everything they've been learning to some different scenarios to make sure they, not just deepen their understanding about the content, but also deepen their experience with the practices they've been engaging in, both analyzing the data, looking for trends and graphs, and explaining their thinking. The practice of constructing explanations shows up multiple times throughout this chapter and 1.5 also gives them more practice with that as well.
Speaker 1: After we finish getting ourselves familiar with the six scenarios, we are going to match them to graphs.
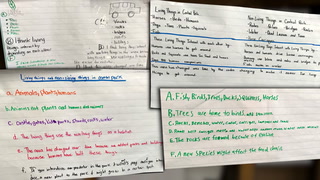
Speaker 2: I began 1.5 by giving them the graphic organizers to fill out as they read each scenario.
Speaker 1: Turn and talk with a team mate, decide is it about biotic factors together, or abiotic affecting a population? Then, kind of paraphrase, what is that scenario all about.
Speaker 3: This one is mostly biotic.
Speaker 1: So what is the biotic factor affecting this population?
Speaker 3: The rainbow smelt.
Speaker 1: So the rainbow smelt is affecting the freshwater lake fish. What's the freshwater lake fish?
Speaker 3: The yellow perch.
Speaker 1: The yellow perch. Okay, good. So let's all write out biotic and summarize what is happening to the yellow perch. Okay, and how is the rainbow smelt affecting it.
Speaker 4: The perch, well all the food that they would eat is being eaten by the new fish that's been introduced.
Speaker 1: So exactly what you just said, should be written in your box.
Speaker 4: So now you have six. Abiotic because the fish needs the oxygen. Okay.
Speaker 1: Make sure you go back to all the biotic ones and identify the pattern of interaction. So what do you think number one was?
Speaker 4: Competition.
Speaker 1: Why? Why does competition make sense?
Speaker 4: It says, for example, they eat much of the food preferred by other fish. They have nearly invaded ...
Speaker 1: Okay, can you put it in your own words.
Speaker 4: Well, yeah, pretty much.
Speaker 5: One fish killed more fish.
Speaker 4: No they eat more fish.
Speaker 1: So is it killing the other fish?
Speaker 4: Yes, by eating it's food.
Speaker 5: Yeah.
Speaker 1: Eating it's food. Not eating the other one, right? So what is it an example of? What did Ryan say?
Speaker 4: Competition.
Speaker 1: What pattern of interaction? Competition. So make sure you guys have that in your answer.
Speaker 2: The graphic organizer I provided them did help them a lot because once the students had finished and moved on to the matching of the graphs, it took less time than what I expected.
Speaker 1: So when you take a look at graph A, observe it and then ask yourself and your team mate, what scenario could it be?
And then you need to explain in a few words why you chose that scenario.
Speaker 6: So write four and six.
Speaker 7: Let's just choose what then write the because later.
Speaker 6: One of these is definitely predator and prey. Because when one population decreases the prey, then the predator population also decreases because they have nothing to eat.
Speaker 1: If you have not started taking a look at graphs, I really want you guys to add it into your planner. Look at graphs A, B and C tonight. Tomorrow we're going to find out the answers at the beginning of class and then we're moving on to the next part of our process and procedure.
Let's go over the answers, graph A. The matching scenario, is scenario two, marine worms and ocean temperatures. Okay.
Speaker 2: So we continued the lesson on the next day, while the students seem really glad that they were identifying the scenarios correctly to the graphs. And so they felt satisfaction that they were getting what we're learning.
Speaker 1: I feel like you guys are doing such a good job using language from the cross cutting concepts. You guys have been using these examples of patterns of interaction, but right now you're giving examples of how biotic and abiotic factors can cause changes or affect populations.
Now that we've analyzed data and we've looked at patterns of interaction, biotic and abiotic factors, we are going to write an explanation. Every team table, I am giving you one of our six scenarios. And as scientists, your job is to explain which graph best represents that scenario. So we're going to use a special graphic organizer called an explanation tool today.
So the tool is like the thinking process of trying to write an explanation. The back side is the final product where everything goes in order for a reader to read your explanation. I have included sentence starters to help you in each of the boxes. Okay?
Let me give you an example of how this is filled out.
Speaker 2: 1.5 is where they really have a sense of constructing a formal scientific explanation with claims, evidence and reasoning to make sure that they understand that practice. And this is their first experience with it.
Speaker 1: So if your scenario is about a biotic factor affecting your population, you have to mention what pattern of interaction that biotic factor is.
Let's start with you Samantha.
Samantha: Scenario one.
Speaker 1: Scenario one, so remind me what scenario one is.
I think they struggle a little bit with reasoning, which is to be expected. I think that's one of the hardest things for students, but I feel like they were able to reference evidence and I feel like they are starting to tie into those patterns of interaction that they've been learning about.
They're going to get more experience with the tool over time, so I don't think its a problem that they struggled with it a little bit. But I was still surprised that they did such a good job.
So which graph matched with scenario one?
Speaker 3: C.
Speaker 1: Why did you think it was C? If one eats the other's food, then the other dies. Okay. So what kind of relationship is that? If something eats ... Okay, excellent. So you're going to want to make sure you write about that in your answer.
Speaker 4: B, C and F both show only biotic factors.
Speaker 3: B, C and F?
Speaker 4: I mean E sorry.
Speaker 3: F is scenario four. Basically graph F is kind of the opposite, it shows what an increase of a factor, right?
Speaker 4: Biotic or abiotic?
Speaker 3: Abiotic.
Speaker 4: [inaudible 00:08:21] That means that they will have to start to die out too, when they die out there's no [crosstalk 00:08:28]
It just keeps going up, down, up, down.
Speaker 1: And that's the pattern you saw on the graph. Up, down, up, down. I see that in the pattern there, okay.
Speaker 4: The thing is that the graph shows that ...
Speaker 1: Basically what you just said to me is what you're writing down.
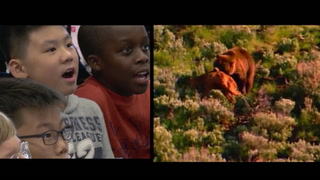
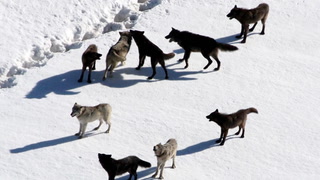
Speaker 2: After the students had completed their first explanation tool, we moved onto the analysis for 1.5 where the students had to make a prediction of what the wolf and elk population would look like on a graph.
Speaker 9: What do you think a graph showing wolves and elk populations over time would look like? I think the elk population would go down. Decrease. Because [crosstalk 00:09:16] at the top, and elk only eat plants. Not really animals.
Speaker 1: So the wolves to Yellow stone? Reintroducing them would be what interaction.
Okay, what do you think?
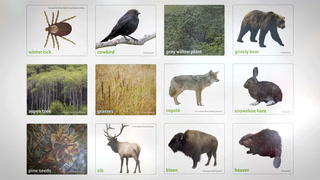
Speaker 7: The wolves are predators, they eat elk, bison, rabbits.
Speaker 1: Yep, there is a lot of prey for them. So there is a lot of predator prey relationships and patterns that they're engaging in.
Speaker 7: But they also compete with the bears ...
Speaker 1: Very good. So it's multiple patterns of interaction.
Speaker 9: Counting by hundreds maybe. So one hundred.
Speaker 7: And then I think the wolves population should start at zero, then sort of go up.
Speaker 5: Yeah, it should be at zero.
Speaker 1: So you think the elk is going to sort of be stable for a bit?
Speaker 7: Yeah, and then once the wolves get introduced, this drops a little bit. And also I thought that they would kind of overlap like this when the elk population is high, the wolf population would be high because they need each other to survive. Well the wolf needs the elk to survive.
Speaker 2: Some students drew their graphs which looked more like the ecological model of the predator and prey interacting with each other. But then there was some that were really close to the real situation of the elk and wolf.
Speaker 1: Siddy, go ahead. Can you describe what you drew.
Speaker 7: Before the wolves came the elk population like, might have been mostly steady, but then when the wolves get introduced, there would be like, quite a drop in the population.
Speaker 1: So let me show what he has.
Speaker 2: 1.5 is a great model because it provides a lot of scenarios for the students to apply the new terms they had learned and the new knowledge that they had gained throughout the chapter.
Speaker 1: Why did you think competition as well?
Speaker 3: Because the wolf and the bear and the coyote, they affect the food chain the most in Yellowstone.
Speaker 1: The students are using their terminology without referring back to their notebook, and finally understanding how there is a pattern of interaction within graphs that they observe.


2 Comments
Charlotte Arvin Feb 18, 2020 1:40pm
Please share where we can find the materials the students and teachers were using to learn.
pamela dougal Nov 9, 2018 9:47am
They had to learn what abiotic and biotic factors wer and how they influenced the ecosystem. The graphs had to match the scenerios to prove their theories. The students had to understand patterns in order to matcdh the graph with the correct scenerio.
Working in groups seemed to encourage the students that did not understand the material that well to form connections. If they were working individually they may have not reached the same level of understanding.
I would really like to know the workbook and supporting materials the teacher was using as a resource. It would be extremely helpful to the teachers in my building