No Series: Graphing Linear Equations - Full Body Style

Math.8.EE.B.5

Common core State Standards

  • Math:  Math
  • 8:  Grade 8
  • EE:  Expressions & Equations
  • B:  Understand the connections between proportional relationships, lines, and linear equations
  • 5: 
    Graph proportional relationships, interpreting the unit rate as the slope of the graph. Compare two different proportional relationships represented in different ways. For example, compare a distance-time graph to a distance-time equation to determine which of two moving objects has greater speed.

Download Common Core State Standards (PDF 1.2 MB)

Graphing Linear Equations - Full Body Style

Lesson Objective: Students graph a line given slope-intercept on a giant coordinate plane
Grades 6-8 / Math / Pre-algebra
5 MIN
Math.8.EE.B.5

PLEASE CREATE A NEW ACCOUNT OR LOG IN TO ACCESS THIS CONTENT

Enjoy your first video for free. Subscribe for unlimited access.


Have questions about subscribing?

Click Here to learn more about individual subscriptions.
Click Here to learn more about School and Institution access.

Discussion and Supporting Materials

Thought starters

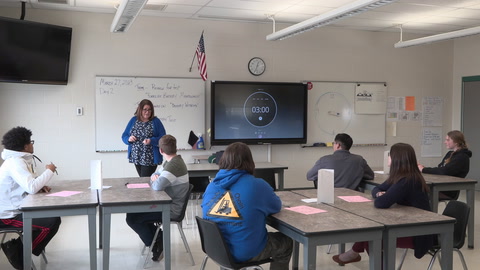
  1. How does Ms. Davis keep all students engaged while each team graphs?
  2. Notice how Ms. Davis pushes the first team by modifying their equation.
  3. How do the students react to this activity that's not just pencil and paper?

42 Comments

  • Private message to Ednor Brevil

This is a great way to get students involved in the lesson. When students take part, especially when they do something visually, auditory, and kinesthetically they can show learning growth a lot quicker.

Recommended (0)
  • Private message to Julio Jacobo-Martinez

I love the idea Ms. Davis had about the lesson. Having the kids move around and be part of the learning process is a great way to promote learning in the classroom. I like how she modified and lesson and started asking essential questions to the class. Anytime you add a little competition within your lesson, you can see the kids, for the most part, get motivated and they seem to enjoy more the lesson. By listening to the students, you can see that the lesson was effective and a success.  

Recommended (0)
  • Private message to Maria Aguilar

Love the idea, and it is not limited to linear equations. It can be adopted in many grade levels and subject areas that require graphing as well. Thank you for sharing.

Recommended (0)
  • Private message to Lauren Gandy

I love this idea! My team and I are planning on doing this as part of our review before our slope and proportional relationships test.

Is there a version of the worksheet that doesn't have the blue background? It is not printing well. Thank you! You're an absolute genius with this!

Recommended (0)
  • Private message to Gaye Salisbury
Chalk is a great idea. I have used painter's tape. Fold the ends back a bit so it is easy to grab when you want to pull it up.
Recommended (0)

Transcripts

  • Great Lesson Ideas: Graphing Linear Equations Full Body Style with Rebecca Davis

    Davis: [00:00:00] Hello. My name is Rebecca Davis. I

    Great Lesson Ideas: Graphing Linear Equations Full Body Style with Rebecca Davis

    Davis: [00:00:00] Hello. My name is Rebecca Davis. I teach seventh and eighth grade pre-algebra at Clyde Boyd Middle School in San Springs, Oklahoma. The lesson I’m going to share with you is called graphing linear equations – full body style. [00:00:11]

    [00:00:14] I wanted to find a way to get them to remember how to graph linear equations, so I thought how can I get them out of their seat, physically doing it? [00:00:23]

    [00:00:23] We’re going to practice graphing using slope intercept form on the floor with your bodies. Okay? [00:00:32]

    [00:00:32] When the students first walk in, they’re going to see the room completely cleared out and a big X and Y axis on your floor. I have them get into groups of three—at least three to four. I give them an equation on the board. One of you be B the Y intercept, and you’re going to step up and start the line. The rest of them are going to be the ends, the slope. And they notice when they’re not getting in a line, they know when one of them is doing something wrong, and then they try to figure it out. So it’s really immediate response, immediate feedback and just extremely successful. [00:01:06]

    [00:01:06] This graph lies—like if you’re in the back, you can see it pretty clearly. This is your Y axis. This is your X axis. This will be the Y. This is the X. [00:01:16]

    [00:01:16] Using duct tape, it’s really easy. You can go through and write on it. You write the origin, write all the numbers one through however far you can get it on your floor, and then the negative side and also up and down the Y axis. [00:01:28]

    [00:01:28] I will give you the line that you’re going to graph first. So do I have a group that would volunteer? [00:01:34]

    [00:01:35] I let them volunteer first cause it breaks the ice a little easier that way. Each group will come up, see an equation and I ask them to start with the Y intercept. Then the slopes will start from there and start stepping out the slope. [00:01:50]

    [00:01:52] Okay, now let’s change your Y intercept from a positive four to a positive seven. What’s going to happen? [00:02:00]

    Child: [00:02:01] Everyone’s going to move up three. [00:02:02]

    Davis: [00:02:03] Move up there, let’s go. [00:02:04]

    [00:02:04] Ask the students after they’ve graphed the initial line to change the Y intercept, to change the slope. [00:02:10]

    [00:02:10] You left [inaudible 02:09] null of it? Very good. Okay do a slope of two. Go ahead. So Alex won’t move. The Y intercept—[00:02:18]

    [00:02:18] Then they can see immediately, oh it’s getting steeper, or it’s translating up so much, or translating back. They see those important effects if you change the line. [00:02:28]

    [00:02:29] Now you’re not as steep. You’re much more flat. Now plus and then you turn positive. [00:02:32]

    [00:02:33] After everyone is finished if time remains, have them compete. See two groups, which one can race and get the line the graph the fastest. [00:02:42]

    [00:02:42] Would you be interested in having a race? [00:02:45]

    Child: [00:02:45] Yeah. Yeah. Yeah. [00:02:50]

    Davis: [00:02:53] Ready? Go. [00:02:54]

    [kids talking and moving 02:54 – 03:01]

    Davis: [00:03:01] When they’re challenged, it’s really funny then, watching them, you step here, no you go back, no wait, go back. It’s really funny. [00:03:09]

    [00:03:11] Time. Okay. 44 seconds. [00:03:13]

    Child: [00:03:16] Yes I did. I had a lot of fun because we usually use pencil and paper and now we’re like acting. [00:03:23]

    Davis: [00:03:23] 18 seconds. [00:03:24]

    Child: [00:03:25] So we get it more, it’s easier. We are getting up and moving around and interacting with each other, so it’s easier and nice. [00:03:34]

    Davis: [00:03:34] Wow. 16 seconds. Very good, are you after it again? Are you ready? [00:03:41]

    [00:03:47] Look how close you guys are. [Laughter] 12 seconds. Very good. [00:03:52]

    Child: [00:03:51] Let’s go. [00:03:52]

    Davis: [00:03:54] Whoa wait minute. [00:03:54]

    [00:03:54] I love it whenever I can get my kids up out of their seats and physically involved in the lesson instead of just sitting down pencil and paper. [00:04:01]

    [00:04:09] This is such a fun and beneficial lesson that I have resources available to help you implement this into your classroom. [00:04:17]

School Details

Clyde Boyd Middle School
305 West 35th Street
Sand Springs OK 74063
Population: 1062

Data Provided By:

greatschools

Teachers

teachers
Rebecca Davis
Math / 7 8 / Teacher