Collaborative Lesson Planning Transcript
+++ 00:00:00 +++
GFX:
Tch
TeachingChannel
+++ 00:00:04 +++
Krista McAtee: It’s because of-- yeah.
Jon Southam: Did we say it at the same time?
Krista McAtee: Yeah.
Jon Southam: Besides our minds being linked.
Krista McAtee: Yeah.
Jon Southam: Uh.. I was thinking it was just a little time away--
Krista McAtee: Timing.
Jon Southam: --timing-wise.
Krista McAtee: Okay.
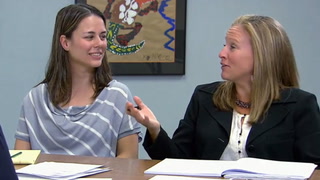
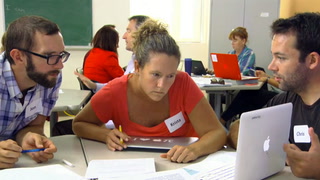
Krista McAtee: I love working with my colleagues, because they all come with their different experience and their set of resources and “Oh, I tried this activity” or “I did this thing.”
Card:
Illustrative Mathematics:
Collaborative Lesson Planning
Lower third:
High School Teacher
Professional Development, Lesson Planning
Sonoma State University, Rohnert Park, CA
+++ 00:00:29 +++
Ben Ford: Okay, so we’re gonna work this afternoon on planning a lesson to implement modeling tasks for the purpose of teaching content in your courses.
Lower third:
Ben Ford
Professional Development Facilitator
Professor of Mathematics, Sonoma State University, Rohnert Park, CA
Ben Ford: And we’re providing in an online folder for use a lesson plan template that you can use if you want to.
Lower third:
Krista McAtee
High School Math Teacher
Sonoma Valley High School, Sonoma, CA
Krista McAtee: Today was an opportunity for me to sit down with two other colleagues and plan some lessons around modeling.
+++ 00:00:53 +++
Chris: Do you have the standard? Like, the actual language of the standard?
Krista McAtee: Yeah. We’re still looking at that.
Chris: All right.
Subtile:
For a function that models a relationship between two quantities
Chris: For a function that models a relationship between two quantities,
Lower third:
interpret key features of graphs and tables
Chris: --interpret key features of graphs and tables
Lower third:
in terms of the quantities.
Chris: --in terms of the quantities. So we can, you know, as length increases, width decreases. They can find intercepts. They can find intervals where the function is increasing, decreasing, positive, negative--
Jon Southam: So there’s a lot of ways we could go with it. So I think we need to pick one--
Krista McAtee: Yeah.
Jon Southam: --whoosh!
Krista McAtee: Yeah.
+++ 00:01:20 +++
Krista McAtee: This is a mathematical modeling task. So making that connection between what’s happening in the world and being able to create a model of that thing that’s happening in the world.
Krista McAtee: So do you want to fit it in or do you want to just have a little thing? That’s the big question, I guess.
Jon Southam: Yeah. I think-- I think so. I think it’d be good to-- especially with graphing and just function in general within to our geometry classes, because they don’t get much use in the curriculum.
Chris: So we’re going stand-alone?
Krista McAtee: Stand-alone? Sounds good to me.
Jon Southam: Sounds good.
+++ 00:01:48 +++
Krista McAtee: We got to use a bunch of different resources around modeling and look at how that would fit into our curriculum and how we might plan a specific lesson or a unit around modeling.
Jon Southam: The v-- I think the videos of the vases and the volume.
Krista McAtee: Yeah.
Jon Southam: The height--
Krista McAtee: Height over volume. The height over--
Jon Southam: Height over time. Volume over height.
Krista McAtee: Yeah. Sorry.
Jon Southam: Yeah.
+++ 00:02:16 +++
Krista McAtee: And the other-- the video was height over time. That’s-- so the video was height over time.
Jon Southam: Yeah.
Krista McAtee: One of the things that I’m really excited about is we’re gonna do the Desmos’ online activity. It’s where a teacher can go online and s-- and set up a couple of activities that the students can then do. So this particular one that we’re gonna do is on the height of a cylinder, or a different container, basically, as it’s being filled and then afterwards they draw a graph of how that-- the height changes over time.
+++ 00:02:50 +++
Jon Southam: We have the task to create a task around modeling with functions, right?
Brigitte Lahme: Well, yeah, so the standard, the FIFB4--
Jon Southam: It hits that standard.
Brigitte Lahme: That hits that standard.
Lower third:
Jon Southam
High School Math Teacher
Sonoma Valley High School, Sonoma, CA
Jon Southam: So I came to the professional development today because I knew I would have time to plan with two of my colleagues, plan a lesson that we would actually be able to implement in our classroom. And we were able to take what we were look-- gonna learn today and do something with it.
Lower third:
Jennifer Wilson
Facilitator, Mathematics Teacher & Specialist,
Rankin County School District, Brandon MS
+++ 00:03:20 +++
Jennifer Wilson: So there is a mathematics assessment project, formative assessment lesson, that talks about the cross-sections of some solids as they’re being filled with water that could be a nice tie-in to that. I mean, that would get one of your geometry--
Jon Southam: Oh.
Jennifer Wilson: --standards as well. They have to draw the cross-sections at a couple of different levels and thinking about what it looks like as water is pouring in.
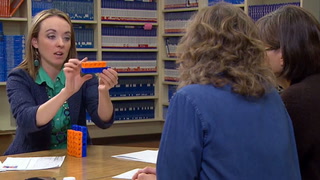
Jon Southam: Oh, so, like, they’re given, like, uhm.. like--
Krista McAtee: Like, this guy.
Jon Southam: --this, but it’s 3-D. So they get, like, the--
Chris: Yeah, so they--
+++ 00:03:55 +++
Chris: Yeah, so, like, circle, circle, rectangle, rectangle, rectangle.
Jon Southam: Something like that.
Krista McAtee: Right.
Jennifer Wilson: And thinking about the size. I mean, that might be throwing a total curve, but it brings that geometry part of it in, too, and then we could begin to think about as it’s filling with water what is-- what would a graph of that look like over time?
+++ 00:04:12 +++
Jon Southam: After we figured out where we’re gonna put it and what we were gonna do, uhm.. we just set up-- we looked at our objective of what we wanted our kids to learn and then we went through what are the students walking in with, what’s the pre-assignment that they’ll be doing, and then what will they be doing in class?
Card:
Two Months Later
Lower third:
Jon Southam’s High School Geometry Class
Sonoma Valley High School, Sonoma, CA
+++ 00:04:32 +++
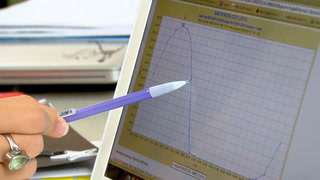
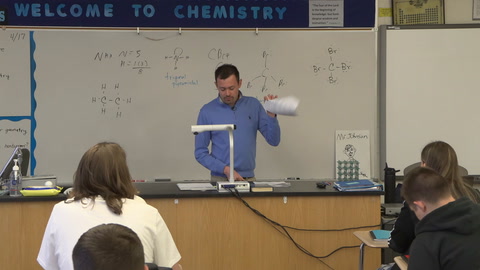
Jon Southam: Would someone please enlighten us: Why does the graph look thusly?
Student: ‘Cause it’s wider at the bottom and it narrows as it rises?
Jon Southam: It’s wider at the bottom-- the vase--
Student: Yeah.
Jon Southam: --is wider at the bottom.
Jon Southam: The lesson, it was modeling a situation with the function.
Card:
CCSS.Math.Content. HSF.IF.B.4
For a function that models a relationship between two quantities, interpret key features of graphs and tables in terms of the quantities, and sketch graphs showing key features given a verbal description of the relationship.
+++ 00:04:48 +++
Jon Southam: They were looking at the height of water in a vase as it’s filling up and graphing that over a period of time.
Jon Southam: So can you then elaborate on why the line is so flat and straight, or so low to the X-axis and straight?
Student: ‘Cause at first it’ll just uh.. it’ll just be at a constant rate at the bottom, ‘cause there’s no, like, uh.. slope to it and then as soon as it slopes it starts to gradually rise.
Jon Southam: More quickly?
Student: Yeah.
Jon Southam: Yeah.
+++ 00:05:23 +++
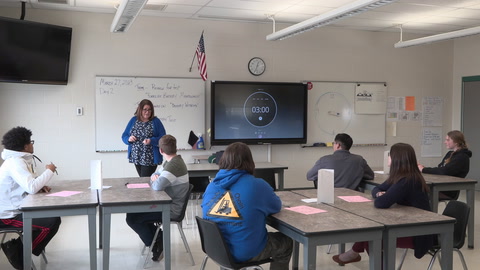
Krista McAtee: The fact that I collaborated with other teachers made the lesson much better, because we-- I was able to use their expertise and have the time to really sit down and focus with other professionals who are interested in the same thing. We have a lesson that we can walk away with that’s much more powerful.
Lower third:
Krista McAtee’s Bridge to Geometry Class
Sonoma Valley High School, Sonoma, CA
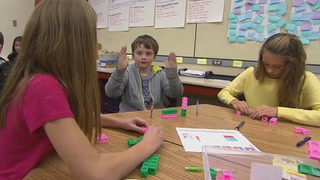
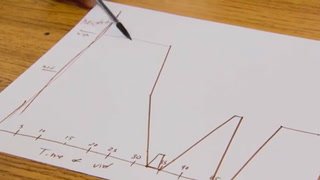
Krista McAtee: Remember on Thursday we did the water line activities, right? And we had lots of cool graphs that you all made. Here’s one of the containers that we had. Now on this piece of paper that you have there I would like for you to draw what you would guess-- and this is just a sketch-- what you think that this graph would look like.
+++ 00:06:01 +++
Krista McAtee: I think that they will have a much deeper understanding of graphing. I think they’ll have a better understanding of slope. They’ll have a better understanding of just X- and Y-axis and how-- you know, all of those pieces, which are really foundational.
Student: It goes slowly up and then it gets, like, smaller on top, and it goes faster.
Krista McAtee: So the speed is faster here?
Student: Mm-hm.
Krista McAtee: Okay. And then-- and then here. Why is it--
Student: It opens up at the top, so it gets wider.
+++ 00:06:33 +++
Krista McAtee: So it’s the opening. Okay, all right. Cool.
Lower third:
Brigitte Lahme
Department Chair, Mathematics & Statistics
Sonoma State University, Rohnert Park, CA
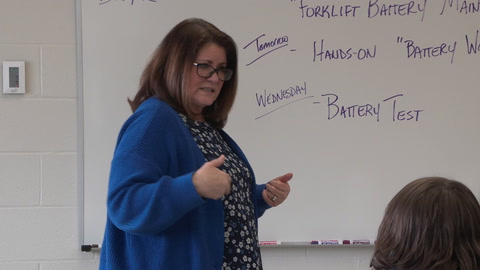
Brigitte Lahme: Mathematical modeling is really the way mathematics gets done in other fields. So it’s using the tools of mathematics to solve contextual and, most of the time, real-world problems.
+++ 00:06:50 +++
Jon Southam: We just decided to take something where we could slide it anywhere, you know, kind of sprinkle it in earlier in the year and maybe touch on it later. So what we decided on was the filling up of the vases with the Desmos calculator.
Ben Ford: You could also in a geometry class-- if you choose the right vases you’d have volume formulae for those-- for some of those shapes and you’d actually develop the tools to be able to write equations for the relationship of height to time if you chose to go that way.
+++ 00:07:19 +++
Brigitte Lahme: A takeaway that we’re hoping the teachers will get is that you can talk about mathematical modeling, parts of it, with smaller tasks that maybe are not quite as overwhelming as the bigger ones. You can teach mathematical modeling and students can engage in worthwhile problems at different levels.
Jon Southam: That’s one of the cool things we were talking about, ‘cause at the end of the year we do get into, of course, volume and so this would be a great way to tie in, refresh their memory on-- “Remember when you did that, that great task that you’re-- that we did?”
+++ 00:07:51 +++
Chris: Then they forget.
Jon Southam: How could they forget?
Jon Southam: This type of collaboration that Chris and Krista and I did was very valuable. It was time well spent, ‘cause we really built something that we can do again and modify and make it more valuable for the students.
Ben Ford: We’re gonna send you off with your rough drafts now and be in touch to wrap these up as you bring them to your classrooms. Thank you all for being here today.
GFX:
Tch
TeachingChannel
#### End of C0804_001008_Lesson_Planning_FINAL.mp4 ####


12 Comments
Maude Turnipseed Mar 26, 2023 6:22pm
What do you think about the video? I think that it is very important to plan with your grade level team. My grade level always share resources and plan units. We planned extra curricular activities together. My experiences have been positive. Did you have a positive experience with collaborative planning?
Christopher Sch... Jan 3, 2023 12:11pm
Does anyone know where to find the Desmos Activity that the teachers used in this video?
The animation was impressive!
LeShontonika Franks Sep 7, 2020 6:56pm
This is I am used to when I substituted teach in elementary. All the teachers if the grade level came together to plan out the lesson plans and the direction for learning over the next week or 2.
Elizabeth Owonikoko Jul 10, 2020 1:42am
In this video, three teachers came together to plan their lessons around what's trendy in the world and then they try to create a model around whatever they choose that is trendy in the world. The teachers collaborate with each other using their areas of expertise to help each other create a better lesson for their students. Collaboration helps to enhance teachers' skills and the feedback they receive from each other helps them get better at their teaching. I think this video demonstrates that the teaching career is not a one-man know it all business. You can always use the help of your peers through collaboration.
Aundrea Gamble Apr 23, 2020 12:35pm
1. How do the teachers plan their lesson around a particular standard?
Teachers plan their lessons around what's happening in the world and then try to create a model around what's happening in the world.
2. How do teachers use the Desmos calculator?
They use the Desmos calculator by creating an online activity for their students to go and graph online while also making sure they hit the particular criteria.
3. How did the collaboration session impact the teachers' lesson?
The teachers' were allowed to collaborate with other expertise to help create better lessons for their students. By collaborating it allows feedback and by having feedback that truly helps teachers get better.