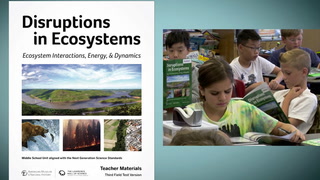
Living and Non-Living Factors in Ecosystems
Speaker 1: Our guiding question for this activity 1.4 is, what effects to living and non living factors have on populations?
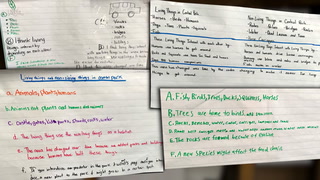
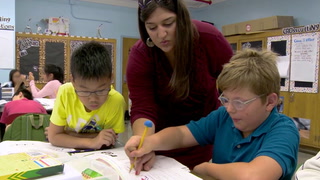
So, in this activity, the students analyze graphs that relate to living and non living factors that can affect populations through time. Activity 1.4 is an explain activity in which students have a chance to look at real data, and continued to synthesize, and apply definitions to the relationships and the interactions as they see the populations affecting each other in graphs.
Take a look at graphs and populations today-
We started our process and procedure where students were told to make a prediction of what a predator and prey graph would look like, and later on they compare it.
Talk about these two questions first and then move on to finishing the predator line and the prey line on your graph. So, make sure you discuss the questions and then see if that affects your drawing, your production.
Speaker 4: When the number of predators increases then that means the number of prey decreases?
Speaker 1: Okay. Share with your partner what you just told me.
In terms of the NGSS, I think that activity 1.4, students have an opportunity to start thinking again more explicitly about the cross cutting concepts. This idea of cause and effect starts to play into their language a little bit more.
Speaker 5: Maybe it will go higher one year, maybe it will go lower.
Speaker 1: What would make it flow? What would cause slight changes in it?
Speaker 5: Probably like there is a lot of snow on year.
Speaker 1: So other non living factors. Take a look at the graph that they have provided you in figure three.
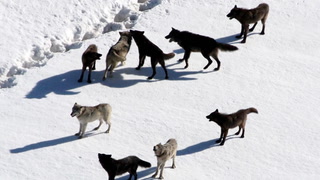
After they drew their prediction, we move into reading a graph about a Predator and prey population and the students analyze that craft. Okay, so you're mentioning that if Moose population went down. Then the wolf population would also decrease.
Speaker 5: Yeah. And there would be a survivor.
Speaker 1: Okay. So you're saying it's not always dependent on just the wolf population. When did you say are some other things that could affect these things?
Speaker 5: Well, there could be pollution which might affect the way they can breathe and there could be less plants for the moose so the moose can start dying because of that.
Speaker 1: So if there were less plants than you think the population of Moose would decrease?
Speaker 6: I agree because like if the moose have no plants to eat then they would go hungry and they would start dying.
Speaker 1: What other factors could effect these populations? Thomas.
Speaker 7: If a moose's diet got scarce.
Speaker 1: Okay. Very good. AJ.
Speaker 8: Well pollution could affect their drinking water and they're breathing air of the air that they breathe.
Speaker 1: Moving on, compare your prediction from number one to the ecological model of predator and prey interactions. If your ideas change explain how they change. If your idea has stay the same, explain what you understand about the predator and prey relationship.
Speaker 8: Claudia, what was your original graph like?
Speaker 2: For the predators? I thought it would decrease just a little bit at the end, but I guess it stayed the same.
Speaker 5: Prey also increases a lot more than the predator than the actual logical model.
Speaker 9: I think that there may have to be more variables in this such as non living factors.
Speaker 1: In the next part the students analyze how non living factor can affect populations over time. They started reading about pronghorn population and how rainfall could affect their population through time.
Once you're done reading, turn and talk to your teammates about the questions they have guided for you, for your graph.
what happened to the [inaudible 00:04:31] population over the years?
Speaker 9: Maybe if you describe it.
Speaker 1: If you are having trouble describing. Remember this great, nifty handout.
So when I found students struggling with analyzing graphs, I knew to tell them to refer back to the pocket guide to reading a guide I had provided for them earlier. The students expanded their descriptions.
So that handout was very useful.
Speaker 6: I'm thinking probably like global warming or climate change that's probably affecting.
Speaker 1: How did you describe the rate over time?
Speaker 6: To be honest I'd say it's more about rain.
Speaker 1: So you saw no pattern role in rainfall?
Speaker 6: Besides the fact that every two years.
Speaker 1: So there is a pattern for saying every two years. Right?
So I hope you said that in your answer. Describe how the amount of rain changed over time. Quinn.
Speaker 10: It fluctuated.
Speaker 1: Okay. Very good. It fluctuated. I think some people were questioning how come a lot of people were comparing 2001 with 1998. Win chang, didn't you talk about it at your table?
Speaker 11: Because um, if the fawn, if the fawns eat more than they could, the population can grow because if they have more to eat, then they can grow and they could, the fawns can increase.
Speaker 1: Okay. So you're saying the grass or the plants grew much more and so they ate much more and increase their population.
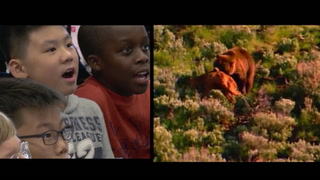
I think the fact that the curriculum uses real data is really important in this activity. They're real world situations that are demonstrating the predator prey relationship.
They're actually looking at real science that they get to be real scientists.
Hey, we're going to take a look at these graphs a little bit deeper now.
And the last part, we finally did our analysis questions where the students looked at the graphs more and then they were asked to make predictions about what were the grass looked like in the future.
Speaker 4: Good question. It says, What do you think caused this pattern? I think through scary [inaudible 00:06:50] for either animal. There could be another predator being introduced that could have been introduced and it could have eaten a lot of the moose too.
Speaker 1: It sounds like you said that they would both increase but that the wolf would increase more than the other one. Record what you just described to me
Speaker 12: It'll probably fluctuate more.
Speaker 1: Continue, fluctuating. And how come?
Speaker 12: Patterns like this usually aren't very steady because there might be a drought and so less water for the plants.
Speaker 1: So you're saying it's going to fluctuate more than what you see.
Speaker 12: No.
Speaker 1: Because you were saying it's not steady if it's studied, they don't follow the same pattern.
Speaker 12: Yeah.
Speaker 1: So you're saying it is studied?
Speaker 12: It's not. It's an endless loop because if you look too much then there's going to be less moose for the wolf to find and so then so then the wolf will decrease and the Moose will increase, then the wolf will eat the moose.
Speaker 1: Like the cycle will continue decreasing. That is study. If it's following the same pattern that is study.
Letter e, let's take a look at it. What do you predict will happen to the size of the wolf and Moose population over the next 10 years? Explain your reasoning. Thomas.
Speaker 7: I think it'll be close to the same pattern as from 1960 to 2015 because it's like the same ecosystem unless something happens with other living or non living factors.
Speaker 1: Okay. Ian. And why do you disagree?
Speaker 4: You're talking about like how the wolf population would grow with more I wolf pups and they start learning how to grow up and eat and chase after the moose and elk and bison.
Speaker 1: Do agree that follows the same pattern though, but just a higher peaks?
Speaker 4: Yeah.
Speaker 1: We're gonna. Leave it here. Finish up questions you did not finish. That is your homework. After 1.4 we move onto 1.5 which is the elaborate stage. The students learn new situations and then apply their learning from the unit to the new situations.


2 Comments
Ryan Cantrell Jul 27, 2020 9:15pm
The students were able to see lessons in a graphical reprsentation, which allowed them to see a visual represntation of the data they were reading. The teacher used questions to evoke thinking instead of basic questions that do not require explanations. By them explaining the content, they are showing they understand what is happening.
Alfra Jeannele ... Jun 1, 2019 5:07pm
This is interesting. Did the materials used (specifically on the data) come from the textbooks or
supplements provided by the school?