Series Engaging Students with "Productive Struggle": Deepening Understanding: Proportional Relationships

Math.Practice.MP1

Common core State Standards

  • Math:  Math
  • Practice:  Mathematical Practice Standards
  • MP1:  Make sense of problems and persevere in solving them.

    Mathematically proficient students start by explaining to themselves the meaning of a problem and looking for entry points to its solution. They analyze givens, constraints, relationships, and goals. They make conjectures about the form and meaning of the solution and plan a solution pathway rather than simply jumping into a solution attempt. They consider analogous problems, and try special cases and simpler forms of the original problem in order to gain insight into its solution. They monitor and evaluate their progress and change course if necessary. Older students might, depending on the context of the problem, transform algebraic expressions or change the viewing window on their graphing calculator to get the information they need. Mathematically proficient students can explain correspondences between equations, verbal descriptions, tables, and graphs or draw diagrams of important features and relationships, graph data, and search for regularity or trends. Younger students might rely on using concrete objects or pictures to help conceptualize and solve a problem. Mathematically proficient students check their answers to problems using a different method, and they continually ask themselves, \"Does this make sense?\" They can understand the approaches of others to solving complex problems and identify correspondences between different approaches.

Download Common Core State Standards (PDF 1.2 MB)

|
Math.7.RP.A.2

Common core State Standards

  • Math:  Math
  • 7:  Grade 7
  • RP:  Ratios & Proportional Relationships
  • A:  Analyze proportional relationships and use them to solve real-world and mathematical problems
  • 2: 
    Recognize and represent proportional relationships between quantities.
    <br />
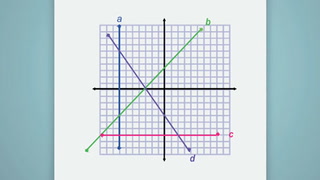
    a. Decide whether two quantities are in a proportional relationship, e.g., by testing for equivalent ratios in a table or graphing on a coordinate plane and observing whether the graph is a straight line through the origin.


    b. Identify the constant of proportionality (unit rate) in tables, graphs, equations, diagrams, and verbal descriptions of proportional relationships.


    c. Represent proportional relationships by equations. For example, if total cost t is proportional to the number n of items purchased at a constant price p, the relationship between the total cost and the number of items can be expressed as t = pn.
    <br />
    d. Explain what a point (x, y) on the graph of a proportional relationship means in terms of the situation, with special attention to the points (0, 0) and (1, r) where r is the unit rate.

Download Common Core State Standards (PDF 1.2 MB)

Deepening Understanding: Proportional Relationships

Lesson Objective: Assess understanding of proportional relationships
Grade 7 / Math / Assessment
10 MIN
Math.Practice.MP1 | Math.7.RP.A.2

PLEASE CREATE A NEW ACCOUNT OR LOG IN TO ACCESS THIS CONTENT

Enjoy your first video for free. Subscribe for unlimited access.


Have questions about subscribing?

Click Here to learn more about individual subscriptions.
Click Here to learn more about School and Institution access.

Discussion and Supporting Materials

Thought starters

  1. Why does Ms. Walker remind students of the feedback questions before starting the post assessment?
  2. How does Ms. Walker use the post assessment to inform her instruction?
  3. Why does Ms. Walker ask the students for real world examples of proportional relationships?

2 Comments

  • Private message to Gretchen Vierstra
Hi Meyosha, MAP's teacher materials may be useful for you to check out since they detail the process for these lessons: http://map.mathshell.org/guides/map_cc_teacher_guide.pdf. In the case of this lesson, I know the teacher did not reteach the full lesson, but rather designed a post assessment lesson based on what she learned from their assessments. Hope that helps!
Recommended (0)
  • Private message to Meyosha Trammell
Do the students complete a post assessment after every formative lesson? If the post assessment shows that the students didn't understand the material do you reteach the lesson?
Recommended (0)

Transcripts

  • Deepening Understanding: Proportional Relationships Transcript

    Speaker 1: You got 10 free so you take 10 off of that one and then

    Deepening Understanding: Proportional Relationships Transcript

    Speaker 1: You got 10 free so you take 10 off of that one and then divide it by 5. Can someone do a more complicated number so like-

    Speaker 2: To see if it still works?

    Speaker 1: Yeah.

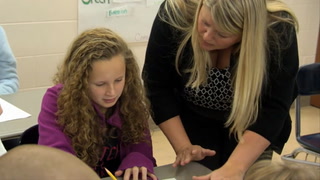
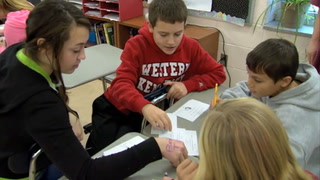
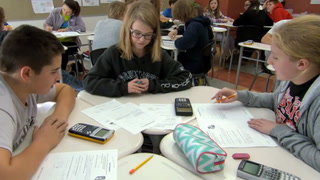
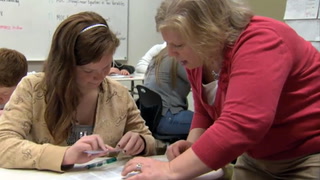
    Speaker 3: This lesson today, the formative assessment lesson, in itself is complete. I thought the kids, they did a phenomenal job in actually grappling with the math and looking at the relationships and expressing their opinion.

    Student: It’s not equal to these but remember, it’s not a proportional relationship either.

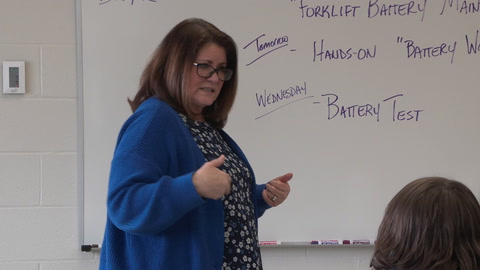
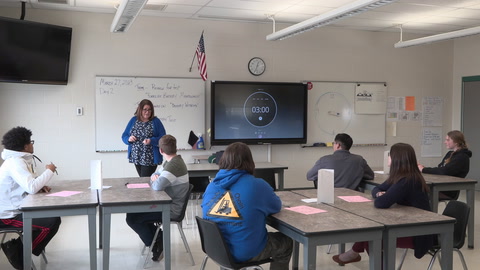
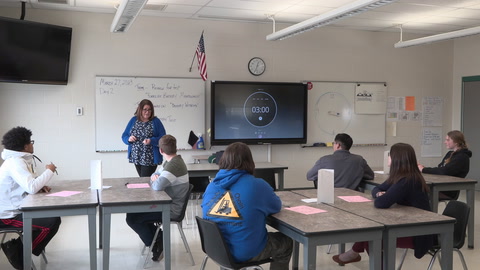
    Speaker 3: Can I have your attention for a moment? Give me five. Okay, so we went through this whole activity over the last couple of days where we looked at these proportional relationships. And if you’ll recall, we started by looking at some questions in our pre-assessment. And I’m going to ask you some questions that may help you think about the work you did and may help you when you look at your post-assessment that you’re about to do. So I want you to think about the [Warhon?] and his paint question. What if he has 15 pints of red? What process would you use to find the blue paint? And I want you to explain or model your process for figuring that out. Secondly, what is the relationship between the red cans and the blue cans of paint? Can you explain or show this relationship? And then the third thing is, how many cans of blue paint would you use for one single red can, and how can you use that in your solution? So these are all of the questions I want you to think about as you think about how you could improve your work on the pre-assessment and apply it to similar situations on the post-assessment. Does anyone have any questions? Okay. We’re going to take a post-assessment now. I want to know what your understanding is. This is going to tell me what you know and don’t know and it’s going to tell me what else I need to work on with you, okay? So it’s like a temperature gauge.

    Speaker 4: After the teachers have completed the formative assessment lesson and students have taken the post-lesson assessment, the teachers convene again in their course-specific groups.

    Speaker 3: So we have our student work after the activity. How did the activity go today?

    Speaker 4: The meeting this afternoon is to now look at our student work that we gathered on the post-assessment and evaluate how the kids look at proportional relationships now, and we actually are going to look at the data and see how much they grow. We know what they knew before by the pre-assessment and we can match up those misunderstandings with the post just to look at their growth.

    Speaker 5: Do we care really which way they did it? Because really what we care about is do they recognize that that’s not a proportional relationship? So I think that that’s okay. Either one of those would be okay.

    Speaker 4: Sometimes what we find is one teacher really struggled with a certain part, but then when they hear how somebody else handled that, it can help them adjust for future lessons.

    Speaker 6: After the card activity, I’m not sure that my students are really focusing on the proportion or non-proportion language. I think they are really focused and concerned on getting the right answer. Does that make sense?

    Speaker 3: What I found is that I had to guide that conversation a lot. Like, “So you think it’s proportional. Why?” So they were referring to all of those characteristics. They were using that language throughout the whole lesson because I was pushing toward that, but I’ve been doing that throughout the whole unit.

    Speaker 4: We have the teachers look at their post-lesson assessments. They’ll go through and they will look at those same misconceptions that we saw and they will try to identify from the post-lesson assessment which students still have that same misconception, and they can see where growth was made and where there is still some work to do.

    Speaker 5: For the paint one, I did ask them what would happen per one can of paint instead of the three and the five. What’s going to happen if you just had the one pint?

    Speaker 4: That one question we talked about, like how many cans of blue paint would you use for one single red can?

    Speaker 5: Right, right, for one single red can. They got that and they were able to figure that out, and then that helped them solve for the seventeen-and-a-half.

    Speaker 3: The lesson and the student work really gives us an anchor to think about future instructions. We’re trying to shift to what the common core is asking us to do and that student work is really a great way to consider that.

    Speaker 5: I think that when we teach this next year, we kind of focus more on that constant proportionality and that unit rate moreso in the problems, because we looked at it a lot in the graphs, so maybe we leave the graphs out a little bit and focus more on that when we look at problems. What do you think about that idea?

    Speaker [4?]: Yes.

    Speaker 3: The formative of assessment lesson in itself is complete, but I now know some things that I think we need to look at a little bit closer; mainly looking at relationships again and just kind of finalizing everything we talked about.

    Good morning, guys! Thank you. So today, what we’re going to do is we’re going to talk a little bit more about proportional relationships. I’m going to give you some activities of like everything we’ve done so far, and let’s just see how comfortable you are with the idea of proportionality, okay? So to start, I’m going to give you one minute. Think about how you see proportionality in the world around you.

    One of the things that I think is most important about these formative assessment lessons and formative assessments in general is that you can’t do anything with it until you use it to inform your instructions.

    Let’s see if we can come up with a list of things that we see around us. Matthew do you have one?

    Matthew: Gas.

    Speaker 3: Gas? What do you mean?

    Matthew: Like if it was $1 a gallon, it would be $1, 1 gallon.

    Speaker 3: Okay, so gas being $1 a gallon. What do you guys think of that?

    Students: I think that’s a good idea.

    Speaker 3: So why is that a proportional relationship?

    Matthew: Because it would be a constant ratio going up every time. It would be going up by $1 and 1 gallon.

    Speaker 3: So what are the two quantities?

    Matthew: The money per gallon and how much gallons.

    Speaker 3: Anyone have anything else to add to that? Colin?

    Colin: If you get zero gallons of gas, it’s going to be $0.

    Speaker 3: Okay, so, that’s awesome. These are some of the things we should look at, right? Let’s hear some more. Emma.

    Emma: The amount of movie tickets you buy to the price of the-

    Speaker 3: When you say price, what do you mean?

    Emma: The price of the tickets to the amount of tickets you buy.

    Speaker 3: Okay, what do you guys think of that? What makes that a proportional relationship?

    Students: [No?].

    Speaker 3: You say no, why?

    Student: Yeah. What if there is like adults and kids and it costs different?

    Speaker 3: You always make me have to think. So what if the price is different? Huh. So give me an example of what that would look like.

    Student: Say that adult tickets were $12 and kids’ tickets were $7 apiece.

    Speaker 3: So would that be proportional to the total cost if you had adults and kids?

    Student: Because there wouldn’t be a constant because you’re having to pay two different prices.

    Speaker 3: Okay, so Emma, let’s go back to what you said. So let’s change it. Let’s be kind of specific about the two quantities.

    Emma: The amount of adult tickets you buy to the price.

    Speaker 3: Okay, so number of adult tickets to total cost?

    Emma: Uh-huh.

    Speaker 3: So we know now after our conversation that we want to get kids looking at that unit rate prior to anything with the graph at all, because we threw the graphs in really early this year. We want to look at the unit rate, the relationships between the quantities and start really honing in on that constant multiple.

    Nick, tell me the values you put in there to make it proportional. What makes this table proportional?

    Nick: For the first one, I put zero.

    Speaker 3: Okay.

    Nick: Because what I did is 8 divided by 2 to get what you multiply by.

    Speaker 3: 8 divided by 2 gave you?

    Nick: 4.

    Speaker 3: 4. So what is that 4?

    Nick: It’s what you multiply x by to get y.

    Speaker 3: Okay, let’s give it a name. What is that?

    Nick: Constant.

    Speaker 3: The constant of what?

    Nick: Of proportionality.

    Speaker 3: So the constant of proportionality makes it proportional. We know we’re multiplying by 4 every time. That is awesome.

    I’m going to take what I learned from looking at the student data on the pre and post-assessments. From what my colleagues and I talked about, what we saw in this lesson and what we saw on the student work, to modify how we teach it next year and from here on.

    How did you find the way we learn proportionality and these activities that we did throughout this whole lesson, and including that lesson we did with the cards yesterday? J.J.?

    J.J.: I liked it because it went in depth with everything and when we got deeper into it, it made it easier for us to understand it.

    Gabby: I don’t know. I didn’t really realize that all this stuff was in your life every day, that you had to do this every day of your life. You go and get gas and you have to do this, or if you go to the grocery store and you have to do this. I never realize that.

    Speaker 3: That’s huge.

    Student: The whole time we’re obviously studying proportional relationships, but I like how we came at like different angles every day, how we got every little detail different ways. We know we can use graphs. We can use ratios, simplifying. And I like how we just different techniques to go through it.

    Speaker 5: Love it, awesome. You guys were amazing. Let me tell ‘ya.

School Details

Twenhofel Middle School
11846 Taylor Mill Road
Independence KY 41051
Population: 841

Data Provided By:

greatschools

Teachers

teachers
Teri Walker
teachers
Jenny Barrett